Philip – the graph comes from the COG website, under… Our Birds/BIRD INFO/scroll down to Pallid Cuckoo/click on the graph symbol at the right.
You will see this:
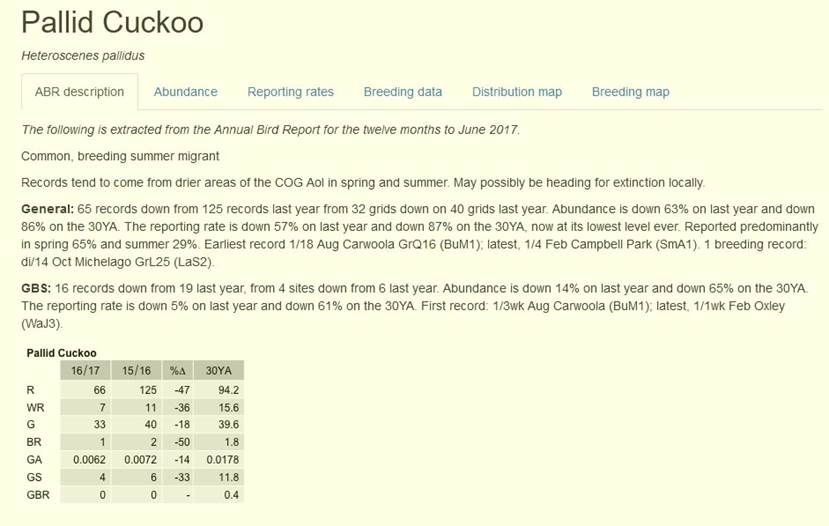
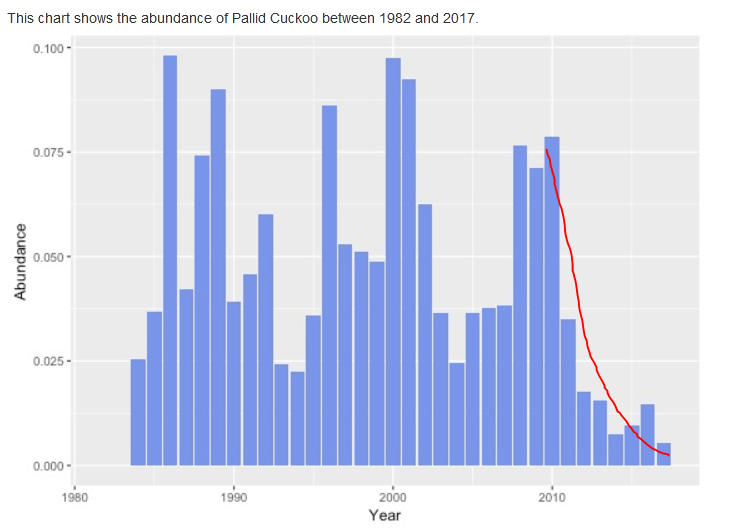
Click on ‘Abundance’ tab to see the chart you are asking about (or the ‘Reporting rates’ tab for the corresponding similar story).
The pages also include spatial data and nesting statistics to add considerably to its usefulness -- it is a rich resource which I believe replaces the need for
atlasing and includes ABR information. In
fact it is similar to what Renée showed is now available from BLA, but with more detail and additional breeding info.
The data itself is extracted from the COG database, the repository of COG sighting data that used to be query-able to answer researchers’ and members’ questions.
I believe it contains the agglomeration of
COG’s various bushland surveys and member records – formal and ad-hoc, and provides separate access to GBS data.
(I think data for the ABS and BIRD DATA does not include the GBS, though that might not be correct). It is the same data that is used for the ABR.
The integrated COG Data Base became unsupportable about 2018 and COG has not managed to replace it despite a committee devoted to the subject since 2011. The loss of the COG Database is the reason why there have been no
ABR reports and no updates to the website ‘BIRD DATA’ after 2017 – the reason the quoted chart ends at 2017.
The information in the Bird Data pages was designed precisely to allow members to easily answer questions like those recently raised about the Pallid Cuckoo.
Obviously it has been missed or not
supported by many, a major disappointment to me as keeper of the website.
Julian
From: Philip Veerman <>
Sent: Wednesday, 2 October 2024 12:50 PM
To:
Subject: RE: [Canberrabirds] Pallid Cuckoo
That is a good graph but where does the data come from? Who is “our” and what is the data source? Why does it stop at 2017? “due to cessation of our bird
database” What cessation of what database is that? I struggle to match that graph to the long term graph in The GBS Report (page 95) that also shows a decline. For what it is worth
I know of only 2 errors in the GBS data in The GBS report. One included Pallid Cuckoo, when some person made a mistake to record “9” on one week when in fact they had seen one on the 9th of the month. An error only found much later. (The other was
one entry of I think 335 House Sparrows on one week on one chart, that actually was 35.)
Philip
From:
Canberrabirds
On Behalf Of broadcanvas--- via Canberrabirds
Sent: Tuesday, 1 October, 2024 9:15 PM
To: 'Renée Ferster Levy'; 'Mark Clayton'
Cc: 'Canberra birds'
Subject: Re: [Canberrabirds] Pallid Cuckoo
Closer to home, our own data tells the same story in the COG area of interest (though our data stops in 2017 due to cessation of our bird database). The local crash in numbers started in 2011. In 2013 I put up the following as one of
the sliding images on the website home page where it has remained … and is still a good question:
The bird data pages on the Pallid Cuckoo show the local story very clearly with no need for fancy stats:
Cheers,
Julian