 |
canberrabirds
|
|
|
canberrabirds
|
| To: | Philip Veerman <> |
|---|---|
| Subject: | Grey Butcherbird |
| From: | Martin Butterfield <> |
| Date: | Fri, 30 Aug 2019 20:25:08 +0000 |
|
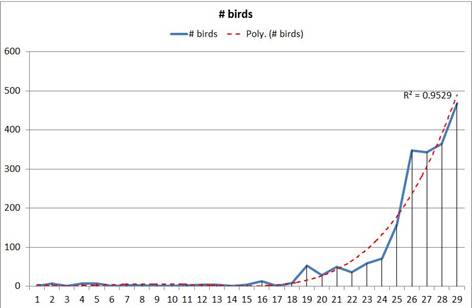
I have confirmed that using A values gives a very similar pattern to simply counting summing the number of birds.
However I think Philip, is correct in his second paragraph in saying that a high proportion of the increase is due to the same birds being reported multiple times. I came to that conclusion
after looking at the % of sites at which the species was reported each year (ie F, rather than A),
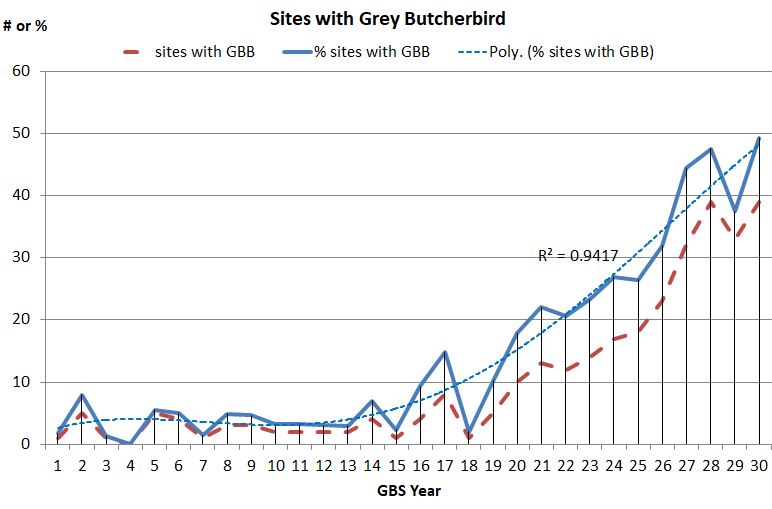 This shows a much more gradual curve rather than a sharp increase around year 24. Repeating the approach from playing around with A I projected a trend in this series up to year 24 forward for 6 years which suggested a value of F of close to 50% - almost
exactly the calculated value.
This it would seem that, rather than the fires as a push factor, some pull factor - possibly flying mincemeat - was making it more attractive for the Butcherbirds to hang about.
As one of my bosses used to say "I'm not often right, but I was surely wrong that time".
Martin Butterfield
On Fri, 30 Aug 2019 at 20:36, Philip Veerman <> wrote:
|
| <Prev in Thread] | Current Thread | [Next in Thread> |
|---|---|---|
| ||
| Previous by Date: | Grey Butcherbird, Philip Veerman |
|---|---|
| Next by Date: | Bluetts Block - Red-capped Robin and Dusky Woodswallow, Jean Casburn |
| Previous by Thread: | Grey Butcherbird, Philip Veerman |
| Next by Thread: | Grey Butcherbird, Philip Veerman |
| Indexes: | [Date] [Thread] [Top] [All Lists] |
The University of NSW School of Computer and Engineering takes no responsibility for the contents of this archive. It is purely a compilation of material sent by many people to the Canberra Ornithologists Group mailing list. It has not been checked for accuracy nor its content verified in any way. If you wish to get material removed from the archive or have other queries about the list contact David McDonald, list manager, phone (02) 6231 8904 or email . If you can not contact David McDonald e-mail Andrew Taylor at this address: andrewt@cse.unsw.EDU.AU