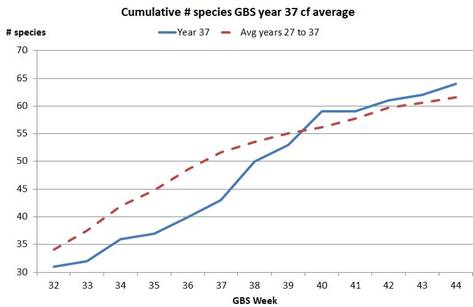
Sort of similar to Figure 14 of The GBS Report (which of course pools data for all GBS charts). Martin’s graph is a usual representation of the trend being
described, although the end point 75 - 80 species for a year is higher than most of us achieve on the GBS. Due no doubt
to available out of town habitat and ability & effort undertaken by observer.
Philip.
From: Martin Butterfield [
Sent: Monday, 30 October, 2017 12:40 PM
To: COG List
Subject: [canberrabirds] Cumulative GBS species
One of my small games with my GBS records is to track the cumulative number of species seen GBS-year to date.
This year started off slowly and fell further behind the 10 year average until it was nearly 9 species behind by early September. Since then the additional species have poured in and I'm now 2
species ahead of the average (with lots of previously seen species to add).
I have graphed the two series starting with week (starting week 32 to avoid any complications caused by variations in the timing and duration of our Winter absences).

I usually end up with 75 - 80 species for a year. This year with an ounce of luck, a pound of axle grease and reasonable rainfall I could expect as many as 85 species.

